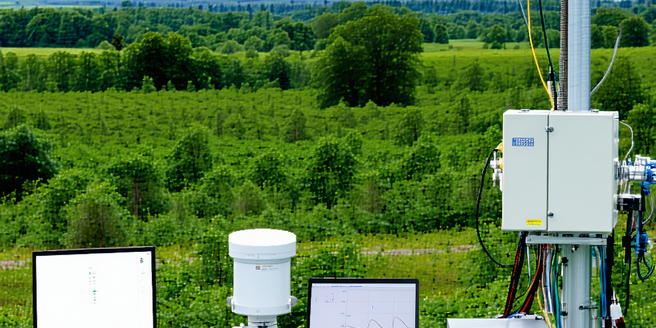
Understanding the Components for a Smart Weather Station
Building a smart weather station involves understanding various components and their functions. At the core, you need a microcontroller or a single board computer to process data. This device acts as the brain of your station, controlling sensors and managing data flow. A power source, whether solar panels or batteries, ensures constant operation. Enclosures protect sensitive electronics from environmental conditions. Additionally, a wide range of sensors are needed to capture multiple weather parameters such as temperature, humidity, wind speed, and precipitation. An anemometer can track wind speed, while a rain gauge measures precipitation levels. Each component must be selected based on specific needs and budget, bearing in mind trade-offs between cost and measurement accuracy. Understanding these fundamentals enables the creation of an effective and reliable weather monitoring system.
Selecting the Right Sensors for Accurate Measurements
Choosing the correct sensors is a critical aspect of building a smart weather station. Thermometers, hygrometers, barometers, and anemometers are common sensors required for comprehensive weather data collection. It’s essential to select sensors that offer high precision and accuracy to ensure reliable readings. For instance, digital sensing elements provide better temperature and humidity measurements compared to analog ones. When considering a barometer for pressure measurements, opt for models that compensate for temperature-induced errors. Wind measurement requires an anemometer, and for rainfall, an accurate tipping bucket or capacitive rain gauge can be used. Compatibility with your primary processing unit, such as Arduino or Raspberry Pi, is vital for seamless data integration. Prioritizing sensor quality over cost can prevent future discrepancies in data analysis, making this selection a fundamental step in the weather station design process.
Building the Weather Station: Step-by-Step Guide
The process of building a weather station initiates with gathering all necessary components, such as a microcontroller, sensors, power supply, and protective enclosures. Begin by assembling the microcontroller, typically an Arduino or Raspberry Pi, as the central processing unit for collecting and transmitting data. Mount the sensors securely to measure temperature, humidity, wind speed, and rain accurately, ensuring each is positioned optimally for precise data capture. Next, connect the sensors to the microcontroller, ensuring firm and clear connections to avoid data corruption. Install enclosures to protect electronics from environmental exposure. After assembling the hardware, test each component individually to confirm proper functioning. Calibrating the sensors subsequent to installation guarantees that the readings are precise. Upon successful evaluation, connect your weather station to a power source, confirming a stable supply for uninterrupted operation. This structured approach aids in creating a functional weather station.
Programming and Calibrating Your Weather Station
Once your weather station components are assembled, the next critical step involves programming and calibrating the system. Programming begins with setting up your microcontroller using suitable software, like Arduino IDE or Python for Raspberry Pi. Write or adapt scripts to manage data acquisition from each sensor and ensure the data is recorded accurately. Calibration is crucial for ensuring that sensors provide accurate measurements. Each sensor often requires unique calibration processes; for instance, thermometers may need temperature adjustment based on predefined constants, while anemometers could require validation against known wind speeds. Implementing periodic calibration checks maintains the reliability of your data over time. It is also advisable to write error-checking code that alerts you to sensor malfunctions or data anomalies. This combination of meticulous programming and careful calibration enhances the dependability and functionality of your weather station, offering precise weather insights.
Connecting Your Weather Station to the Internet
A modern smart weather station is not complete until it can communicate its findings in real-time. Connecting your station to the Internet allows for seamless data sharing and analysis. Firstly, choose a communication module compatible with your microcontroller such as Wi-Fi, Ethernet, or GSM, depending on your location and resources. Integrate this module onto your board securely to enable data transmission. Program your system to send the collected data to cloud services or databases that can store and process it. Platforms like Thingspeak or OpenWeatherMap offer frameworks for real-time data visualization and sharing. Setting up a dedicated server can also allow for personal data management. Testing the data transmission ensures that it’s fault-free and secure. By effectively connecting your weather station online, you facilitate remote monitoring and data accessibility, making the weather data available for analysis from anywhere.
Analyzing and Visualizing Weather Data Effectively
Once your weather station is fully functional and transmitting data, analyzing and visualizing the weather data becomes a priority to derive meaningful insights. Start by structuring collected data into comprehensible formats, suitable for analysis. Utilize data analytics platforms or software like Python’s Pandas library for processing large datasets, enabling aggregation, filtering, and statistical analysis. Visualization tools like Matplotlib or Tableau can transform raw data into accessible graphical formats, creating dynamic charts, graphs, and dashboards. These visuals aid in identifying patterns, trends, and anomalies in weather variables. Overlaying different types of weather data on a single timeline can help correlate various environmental factors. Including predictive analytics enhances the forecast capability of your setup. Regularly updating your visualization ensures stakeholders receive the latest insights. Effective data analysis and visualization make your smart weather station an invaluable tool for weather prediction and decision-making.
