Introduction to Arduino and Weather Stations
Arduino offers a powerful open-source platform for creating customized electronic projects, including weather stations. This microcontroller is versatile, easy to program, and allows for a hands-on approach to understanding electronics and coding. Weather stations serve as excellent projects for beginners, enabling them to learn how to monitor environmental conditions such as temperature, humidity, and atmospheric pressure. By using Arduino, enthusiasts can develop personalized weather stations that gather data and provide insights into local weather patterns. This project combines the world of electronics and programming, offering both an educational and practical venture. Users not only gain technical skills but also create something that can be used in real-life scenarios, showcasing Arduino’s adaptability in building functional and meaningful devices.
Essential Components for Building a Weather Station
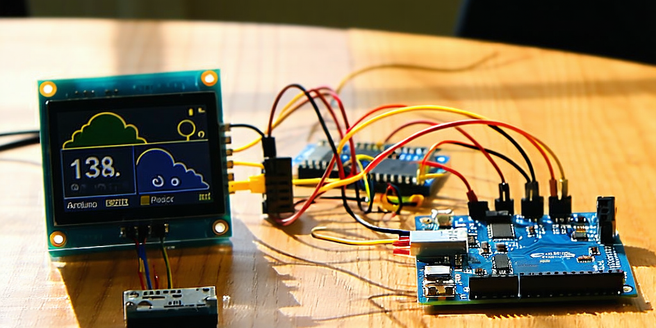
Building an Arduino-based weather station requires several essential components. First, an Arduino board is needed as the project’s core, where all sensors connect and communication occurs. Sensors such as temperature, humidity, and pressure sensors are crucial for collecting accurate weather data. A power source, typically a battery or USB power, ensures the station’s operation. You’ll also need jumper wires and a breadboard to connect components efficiently. For data display, an LCD can be useful, or alternatively, a computer or smartphone connection may be designed for real-time monitoring. Enclosures are necessary to protect your setup from harsh weather conditions. By understanding these essential components, hobbyists can easily gather requisite parts and begin crafting a functional, reliable weather monitoring system with an Arduino at its heart.
Step-by-Step Guide to Setting Up Your Arduino Station
Setting up your Arduino weather station involves several organized steps. Begin by gathering all necessary components, including the Arduino board, sensors, and power supply. Next, assemble the components on a breadboard, ensuring each sensor is properly connected to the Arduino. Once the hardware setup is complete, download and install the Arduino IDE on your computer to start programming. Write or obtain source code that reads data from your sensors and uploads it to your chosen display method. Connect the Arduino to your computer via USB and upload the code. Test the connections and verify that the data readings are accurate. Finally, decide on a casing or enclosure, ensuring all components are secured and protected from the environment. With patience and attention to detail, you’ll have a fully functional weather station.
Coding and Programming Your Weather Station
Programming is a crucial aspect of your Arduino weather station, dictating how sensors interact and data is processed. Utilizing the Arduino IDE, you can write custom code to instruct your microcontroller on handling information from each sensor. Start by familiarizing yourself with sensor-specific libraries available in the Arduino community, which simplify data collection procedures. Coding involves initializing the sensors, reading data values, and storing or displaying these readings effectively. You might want to consider adding functionality for logging historical data, which can be analyzed over time. The ability to display current readings and alert for specific conditions is also achievable through programming. With well-written code, your weather station becomes more than a mere data collector—it transforms into an insightful instrument offering meaningful environmental insights.
Analyzing and Visualizing Weather Data
Once your Arduino weather station is operational and collecting data, the next step is analyzing and visualizing this information. Effective data analysis helps in understanding weather patterns, predicting trends, and identifying anomalies. Begin by exporting collected data to a computer or cloud service for detailed examination. Software tools such as Excel or programming languages like Python can be used to create graphical representations of the data, including charts, graphs, and other visual aids. Visualizations make it easier to comprehend large datasets and derive actionable insights. Additionally, consider implementing real-time data visualization by using web interfaces or mobile applications. Through these tools, users are provided with an intuitive way of monitoring and interpreting weather data, extending the practical applications of your Arduino-based weather station project.